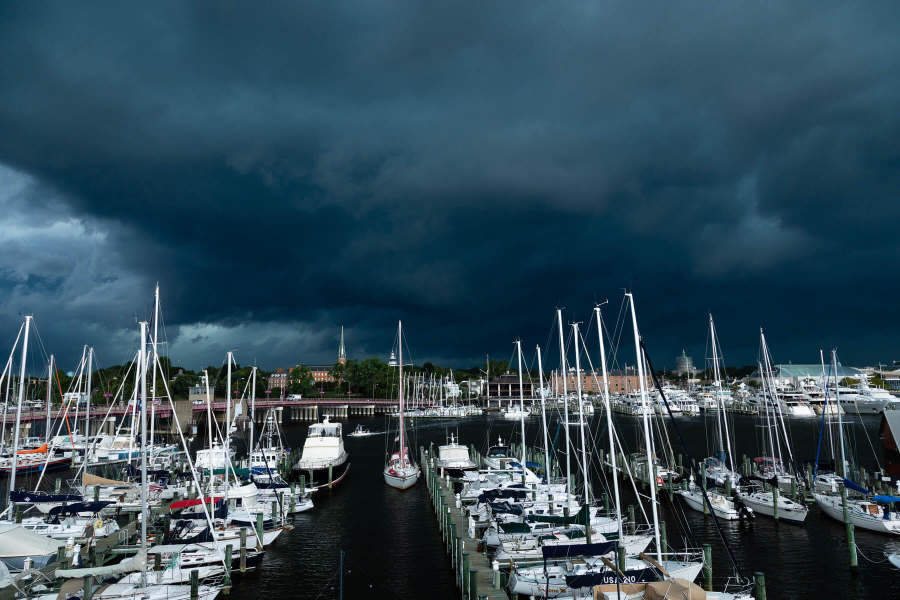
Bay sees worst dead zone in the past five years
Warming temperatures and heavy rainfall impact size, duration

The Maryland Department of Natural Resources recently noted in their September Hypoxia Report that the 2019 dead zone in Maryland’s portion of the Chesapeake Bay was the third largest observed since monitoring began in 1985. These findings are in tune with the Virginia Institute of Marine Science’s (VIMS) recently-released annual Dead Zone Report Card, which covers the entire Bay, although there are slight variations in data collection due to different reporting periods and regions. Earlier this year, the University of Maryland Center for Environmental Science forecasted that the 2019 dead zone would be the fourth largest since monitoring began.
The “dead zone” is an area of little to no oxygen that forms when excess nutrients enter the water through polluted runoff and feed naturally-occurring algae. This drives the growth of algae blooms, which eventually die and decompose, removing oxygen from the surrounding waters faster than it can be replenished in the process. This creates low-oxygen—or hypoxic—conditions. Plant and animal life are often unable to survive in this environment, which is why the area is referred to as a dead zone.
Heavy rainfall across the Chesapeake region in 2018 led to stronger river flows entering the Bay, which brought with them increased amounts of nutrient and sediment pollution. Excess nutrients enter the water through polluted runoff coming from cities, suburbs and rural areas.
Additionally, the summer of 2019 brought hot temperatures and weak winds. These conditions allowed the dead zone to grow larger and last longer into the fall—something that also occurred in 2018. Stronger winds came into the Chesapeake Bay in late August and early September 2019, thanks in part to Hurricane Dorian, which helped to lessen the dead zone. However, the dead zone returned in late September and early October due to lingering high temperatures.
Overall, the 2019 dead zone lasted for 136 days—13 days longer than 2018. The 2019 dead zone covered an average of 1.5 cubic miles during the summer and reached a maximum size of 3.1 cubic miles, compared with an average of 1.2 cubic miles and a maximum of 2.5 cubic miles in 2018. To put that into perspective, at its largest, the size of the dead zone was equal to approximately 5.2 million Olympic-sized swimming pools.
While this announcement may seem worrisome, this year’s dead zone is still considered to be in a normal range, albeit on the high end. Dr. Marjy Friedrichs from VIMS is reassured that the actions in place to restore the Bay are also helping to combat the dead zone. She explains that “even with environmental conditions that favor severe hypoxia, including record-high river input and light winds, our analysis shows that the total amount of hypoxia this year was within the normal range seen over the past 35 years.”
The Chesapeake Bay may continue to experience longer and lengthier dead zones in the coming years as temperatures become warmer and extreme weather continues to become the norm. Climate change is causing late spring to behave like early summer, causing low-oxygen conditions to begin earlier and last longer. In addition, warmer waters aren’t able to hold as much dissolved oxygen, making it easier for dead zones to form.
Check out some helpful tips and tricks that you can take to help lessen the impacts of climate change.

Comments
Thank you for your comment regarding the conflicting dead zone reports by the Virginia Institute of Marine Science and the Maryland Department of Natural Resources. The MD DNR and VIMS reports vary due to different lengths in reporting periods, areas in which are monitoring and variations in the reporting model.
MD DNR monitors the hypoxic conditions in the Maryland portion of the Bay, while VIMS monitors the full Bay. VIMS stated, “The findings of the VIMS hypoxia model and Dead Zone Report generally match the monitoring-based report provided by the Maryland Department of Natural Resources for the Maryland portion of the Bay. Slight variations in results are due to different reporting periods and regions, as the Virginia report includes results for the full Bay from the onset of hypoxia in spring to its cessation in the autumn, while Maryland’s DNR focuses on Maryland conditions from June through September.”
How can this be?
VIMS dead-zone report card reflects improving Bay water quality
by David Malmquist | November 19, 2019
Hypoxia in 2019 falls within normal range despite high river flow and light winds
https://www.vims.edu/newsandevents/topstories/2019/deadzone_rcard_19.php?utm_source=WAY+E-News+December+2019&utm_campaign=WAY+E-News&utm_medium=email
Bay sees worst dead zone in the past five years
MDDNR 12/3/2019
Warming temperatures and heavy rainfall impact size, duration
https://www.chesapeakebay.net/news/blog/bay_sees_worst_dead_zone_in_the_past_five_years
Thank you!
Your comment has been received. Before it can be published, the comment will be reviewed by our team to ensure it adheres with our rules of engagement.
Back to recent stories