Nutrient Runoff
Plants and animals need nutrients to survive. But when too many nutrients enter waterways, they fuel the growth of algae blooms and create conditions that are harmful to underwater life.
Overview
Plants and animals need nutrients to survive. But when too many nutrients enter rivers, streams and the Chesapeake Bay, they fuel the growth of algae blooms and create conditions that are harmful for fish, shellfish and other underwater life. In fact, excess nutrients are the main cause of the Bay’s poor health.
Why are excess nutrients a problem for the Chesapeake Bay?
Excess nutrients fuel the growth of harmful algae blooms, which:
block sunlight from reaching underwater grasses, and
during decomposition, create low-oxygen “dead zones” that rob the water of oxygen and suffocate marine life.
How do excess nutrients enter the Chesapeake Bay?
While nutrients are a natural part of the Chesapeake Bay ecosystem, nutrients have never been so abundant in the environment. Before humans built roads, homes and farm fields, most nutrients were trapped and absorbed by forest and wetland plants. As these habitats were removed to accommodate a growing population, nutrient pollution to the Bay increased.
Almost all people and industries in the watershed—and even some outside of the watershed—send nutrients into the Bay and its tributaries. Nitrogen and phosphorous are the two nutrients of concern in the area. In general, these nutrients reach the Bay from three sources: wastewater treatment plants; urban, suburban and agricultural runoff; and air pollution.
- There are hundreds of wastewater treatment plants in the watershed. In 2005, watershed jurisdictions put a new permit process in place to limit the amount of nutrients these plants could send into rivers and streams. Computer simulations of pollution controls put in place between 2009 and 2015 indicate that nitrogen loads to the Bay from wastewater treatment plants and combined sewer overflows have declined 57 percent since 1985, while phosphorous loads from the same sources have declined 75 percent.
- Nutrients that run off of the land and into the water through urban, suburban and agricultural runoff come from a range of sources, including lawn fertilizers, septic systems and livestock manure.
- Air pollution emitted by cars and trucks, industries, gas-powered lawn tools and other sources contributes about one-third of the total nitrogen load entering Chesapeake waterways. This air pollution can come from any location within the Bay’s “airshed,” which measures about 570,000 square miles and stretches to Canada, Ohio and South Carolina.
- Nutrients can also come from natural sources, like soil, plant material and wild animal waste.
How much nitrogen and phosphorus enters the Chesapeake Bay?
During 2021, average river flow to the Bay measured 54.8 billion gallons per day, a 4.5 billion gallon per day increase from 2020, and a 9% increase from the 1985-2021 mean. The corresponding pollutant loads entering the Bay in 2021 were approximately 286 million pounds of nitrogen and 19.9 million pounds of phosphorus. While all of these are below the 1985-2021 mean, they are increases from 2020 (up 16%, 38%, and 19% respectively).
Nitrogen Pollution
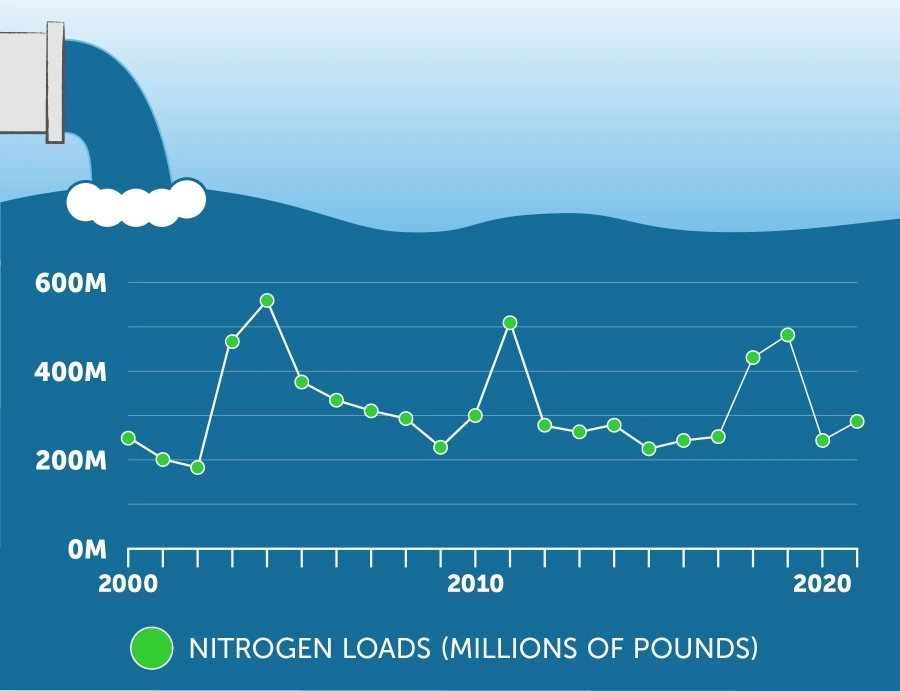
Show image description
The line graph shows the span of time from 2000 to 2021 and nitrogen loads from 0 to 600 million pounds. It begins between 200 million and 300 million pounds in 2000, drops to its lowest below 200 million in 2002, then quickly rises to a peak well above 500 million in 2004. From there, it decreases to a low point in 2009, just above 200 million, before increasing to just above 500 million in 2011. In the next year it drops to just below 300 million and stays between 200 and 300 million until 2018, when it rises to above 400 million and then nearly 500 million in 2019. In 2020 it drops back to between 200 and 300 million, with an increase closer to 300 million at the end of the chart in 2021.
Phosphorus Pollution
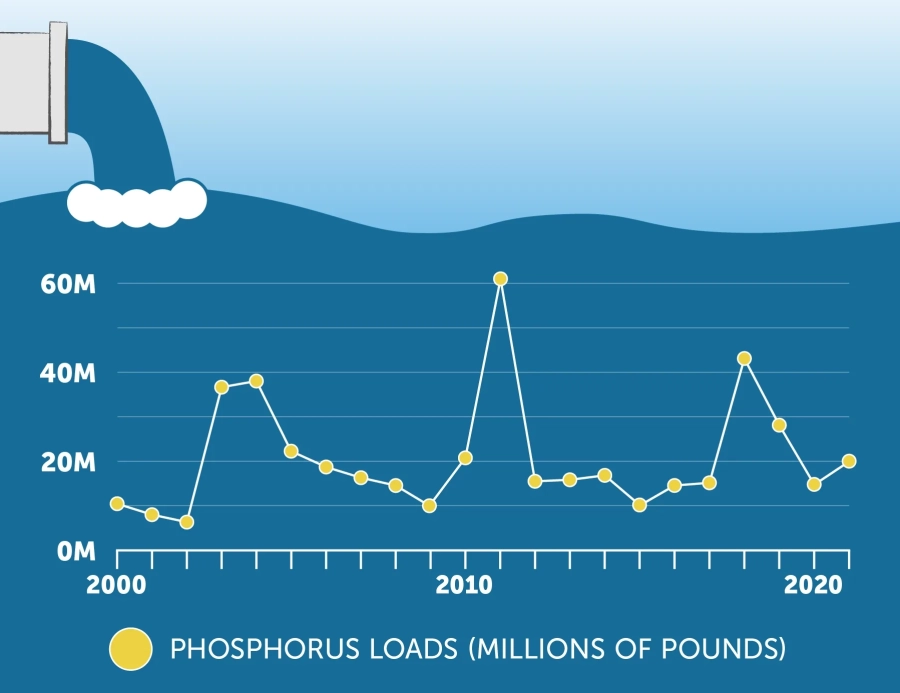
Show image description
The line graph shows the span of time from 2000 to 2021 and phosphorus loads from 0 to 60 million pounds. It begins in 2000 just above 10 million pounds and drops slightly in 2001 and 2002 before surging up to over 35 million in 2003 and almost 40 million in 2004. It then drops to just over 20 million and continues dropping to 10 million in 2009 before increasing again, to a huge peak of over 60 million in 2011. It then drops to around 15 million in 2012 and stays relatively stable until dipping 10 million in 2015, then returning to around 15 million. It jumps again in 2018 to over 40 million, then drops steadily to return to around 15 million in 2020. In 2021, the last year shown, there is an increase to 20 million.
What you can do
To lower nutrient pollution in the Bay watershed, consider reducing the amount of pollution that can run off your property: install a green roof, rain garden or rain barrel to capture and absorb rainfall; use porous surfaces like gravel or pavers in place of asphalt or concrete; and redirect home downspouts onto grass or gravel rather than paved driveways or sidewalks. If you have a lawn to take care of, use fertilizers properly: do not use more than needed, and do not apply to dormant lawns or frozen ground. You can also reduce air pollution by walking, biking or taking public transportation, or using electric or manual lawn mowers and yard tools instead of gas-powered machines.