Water quality improves, pollution falls in the Chesapeake Bay
Data show significant drop in nutrient and sediment loads

The amount of nutrient and sediment pollution entering the Chesapeake Bay fell significantly between 2014 and 2015, helping improve water quality in the nation’s largest estuary. Experts attribute this drop in pollution loads to dry weather and below-normal river flow, but note local efforts to reduce pollution also played a role. Indeed, related research shows “best management practices”—including upgrading wastewater treatment plants, lowering vehicle and power plant emissions, and reducing runoff from farmland—have lowered nutrients and sediment in local waterways.
Excess nutrients and sediment are among the leading causes of the Bay’s poor health. Nitrogen and phosphorus can fuel the growth of algae blooms that lead to low-oxygen “dead zones,” while sediment can suffocate shellfish and block sunlight from reaching underwater grasses. By tracking pollution loads into rivers and streams, the Chesapeake Bay Program (CBP) can ensure our partners are on track to meet clean water goals.
According to data from the CBP and the U.S. Geological Survey (USGS), nitrogen, phosphorus and sediment loads to the Bay were below the long-term average in 2015. Between 2014 and 2015, nitrogen loads fell 25 percent, phosphorus loads fell 44 percent and sediment loads fell 59 percent. Below-average loads are considered positive because reductions in nitrogen, phosphorus and sediment pollution can improve water quality.
The most recent assessment of water quality—which examines dissolved oxygen, water clarity and chlorophyll a (a measure of algae growth) in the Bay and its tidal waters—makes these improvements clear: between 2013 and 2015, an estimated 37 percent of the tidal Chesapeake met water quality standards. While this is far below the 100 percent attainment needed for clean water and a stable aquatic habitat, it marks an almost 10 percent improvement from the previous assessment period.

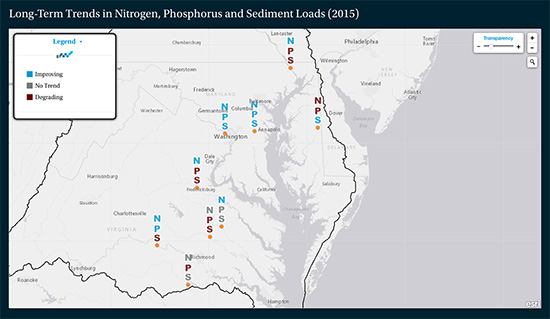
A large portion of pollution loads enters the Bay from the rivers within its watershed. Accordingly, the USGS tracks both annual pollution loads and trends in these loads at monitoring stations along nine of the biggest rivers that feed the Bay. In some cases, long-term pollution trends at these stations reflect efforts to improve water quality. Long-term trends in nitrogen, for example, are improving at six of the nine monitoring stations. Long-term trends in phosphorus and sediment, however, are more variable, and short-term pollution trends show less improvement.
“While the lowered amount of pollution entering the Chesapeake Bay in 2015 is encouraging, the trends of nutrients and sediment over the last decade in the major rivers flowing into the Bay show mixed results,” said U.S. Geological Survey Chesapeake Bay Coordinator Scott Phillips in a media release. “There will need to be improving trends in all of these rivers to support improvement in the Bay’s health.”

Last year’s decline in pollution loads can, in large part, be attributed to favorable weather. While high precipitation can increase river flow and push pollution into the Bay, river flow was below normal in 2015. The long-term decline in pollution loads can also be attributed to on-the-ground pollution-reducing practices, which jurisdictions put in place to meet first the 1983 Chesapeake Bay Agreement, then similar agreements signed in 1987 and 2000, and later the requirements of the Chesapeake Bay Total Maximum Daily Load (Bay TMDL). As of 2015, computer simulations show these practices are in place to achieve 31 percent of the nitrogen reductions, 81 percent of the phosphorus reductions and 48 percent of the sediment reductions necessary to reach our clean water goals.
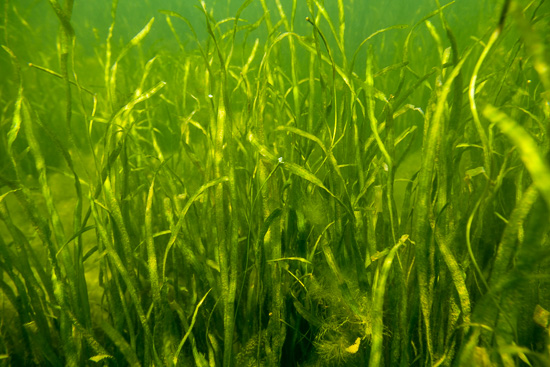
While improvements in water quality will take time—due in large part to the lag between the implementation of a conservation practice and the visible effect of that practice on a particular waterway—the ecosystem is beginning to respond to protection and restoration efforts. Last year, researchers observed more than 91,000 acres of underwater grasses (also known as submerged aquatic vegetation or SAV) in the Bay, which surpassed the Chesapeake Bay Program’s 2017 restoration target two years ahead of schedule and marked the highest amount ever recorded by the Virginia Institute of Marine Science aerial survey.
“As an SAV biologist, I’m thrilled to see these improving trends in water quality, whether they’re an effect of low flow or our pollution reduction efforts, or both,” said Maryland Department of Natural Resources Biologist and Submerged Aquatic Vegetation Workgroup Chair Brooke Landry. “Better water quality means more SAV, and more SAV means more food and habitat for the fish, invertebrates and waterfowl that depend on it. In 2015, SAV expanded in areas throughout the Bay, and even appeared in places where it's never been recorded before, reaching almost 50 percent of our ultimate restoration goal. This is very exciting and provides the incentive we need to stay on track with our efforts to clean up the Bay. It’s not always easy, but it’s worth it.”
“The ecosystem of the Chesapeake Bay watershed is large and complex and can be affected by a variety of different factors,” said Chesapeake Bay Program Director Nick DiPasquale in a media release. “We are witnessing improvement in a number of our indicators—bay grasses, water clarity and water quality standards attainment, as well as a number of our fisheries such as blue crab population. But we must stay focused and ramp up our pollution reduction efforts if we are to be successful over the long term.”
SaveSaveSaveSave

Comments
There are no comments.
Thank you!
Your comment has been received. Before it can be published, the comment will be reviewed by our team to ensure it adheres with our rules of engagement.
Back to recent stories