Chesapeake Bay scores a ‘C’ in 2022, one percent higher than last year
Annual report card provides data on environmental justice for the first time
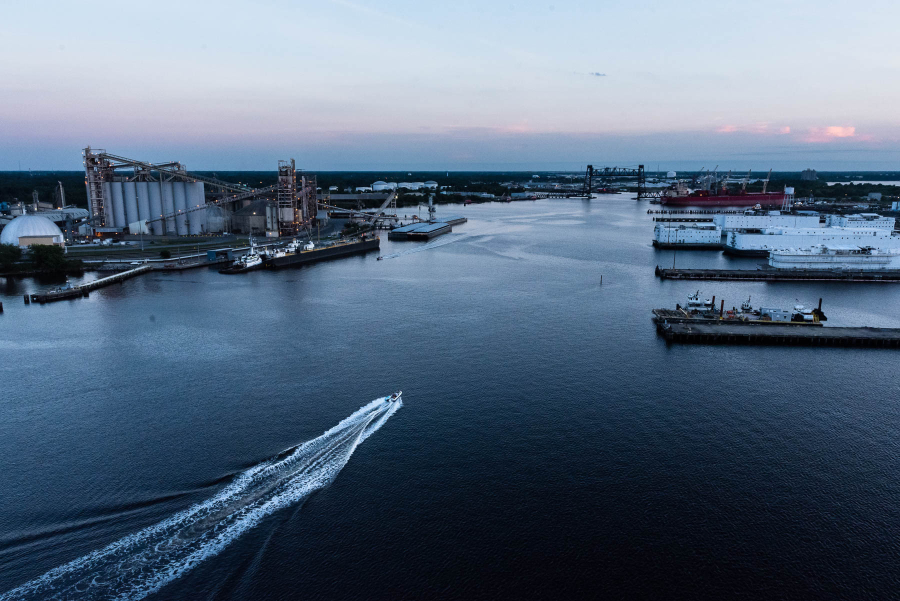
Each year, the University of Maryland Center for Environmental Science (UMCES) releases a Chesapeake Bay Report Card scoring the Bay and its watershed on various indicators. In the most recent report card, researchers note the Bay showing moderate health with several long-term improvements occurring in the estuary.
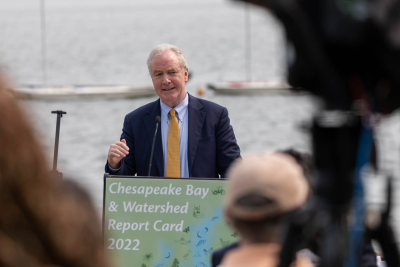
For the second year in a row, the Chesapeake Bay received a ‘C’ in overall Bay health, improving by one percentage from last year (51% to 52%). Four of the seven indicators used to score the Bay’s health improved this year and also show a long-term positive trend: dissolved oxygen, total nitrogen, total phosphorus and aquatic grasses. At the press conference to announce the report card scores, held at the Washington Sailing Marina in Alexandria, Virginia, UMCES attributed improving scores to the effectiveness of the Chesapeake Bay Total Daily Maximum Load ( Bay TMDL), which sets limits on the amount of nutrient and sediment pollution entering the Bay.
“While the trajectory of improvements, particularly concerning nutrients in the Bay, is in the right direction, we need to pick up the pace of restoration so that we can hit our nutrient reduction targets in the future and ensure our resilience to climate change,” said UMCES President Peter Goodwin.
Two other indicators used in the report card—water clarity (how much light penetrates through a water column) and Chlorophyll-a (a measure of algae growth)—show a declining long-term trend, though water clarity did improve from 12% in 2021 to 20% in 2022. The last indicator, benthic communities (a measure of the conditions of organisms living in bottom areas of the Bay) saw no change from the previous year.
Measured separately from the Bay health score, the fisheries index scored a 65% or ‘B’ in 2022. This index is made up of data related to the health of striped bass, bay anchovy and blue crabs. Of the three, bay anchovy scored the highest at 89%, followed by striped bass as 61%. Blue crabs received a 45%, the lowest score in several years.
Of the 15 regions of the Bay, nine scored higher than last year and six scored lower. The highest scoring region for the second year running was the Lower Bay (69%), which improved by 4% in 2022. Regions showing significant improving trends were the James and Elizabeth rivers, Upper Bay, Western Shore, and despite being the lowest scoring region, the Patapsco and Back rivers (24%). The Choptank River (34%) saw the highest decline, decreasing 14 points, followed by the Upper Eastern Shore (27%), decreasing four points.
In later sections of the report, the health of the entire watershed is outlined. This portion of the report card accounts for all seven jurisdictions in the watershed: New York, Pennsylvania, Maryland, Delaware, Virginia, West Virginia and Washington D.C. Based on three categories of indicators—ecological, societal and economic—the overall watershed received a 52%, equivalent to a ‘C.’
The ecological section received a 61% this year. Divided into four categories, this B- was determined by assessing protected lands, water quality, stream benthic communities and new this year, fish communities. The Fish Community index, which assesses river health using data related to native species and pollution tolerance, had an overall score of 48%. The Water Quality Index, a combination of total nitrogen and total phosphorus entering the watershed, scored a 68%. Since no new data had been collected for Protected Lands (74%) and Stream Benthic community (52%), 2020 scores were referenced.
Decreasing seven points from last year, the societal section received a 47%. This decline is driven by decreases in Walkability (how many people can walk to a green space in 10 minutes) and the Heat Vulnerability Index (measure of climate-safe neighborhoods). The Social Index (measure of how a community can respond to hazardous events), also decreased three points, scoring a 57%. The Stewardship Index (which measures stewardship in categories of behavior, volunteerism and civil engagement) remained the same as in past years.
The economic section was first used last year and includes four categories: median household income, jobs growth, income inequality and housing affordability. Mirroring last year’s score, the economic section received a 51%. Data in the report indicate that economic conditions tend to be better in lower regions of the watershed and on the Western Shore.

At the press event, Maryland Senator Chris Van Hollen explained how the health of the Chesapeake Bay is directly tied to the health of the entire regional economy.
“A clean Bay supports a healthy economy and a healthy environment,” Van Hollen said. “That’s why we’ve fought so hard to protect and restore this national treasure, and this progress shows that the historic federal investments are making a real difference.”
This year, UMCES used the Center for Disease Control’s Environmental Justice Index (EJI) to map and characterize the cumulative impacts and patterns of environmental injustice across the watershed. Health, economy, social justice and environmental quality are the four main aspects considered in this index. After thorough analysis, trends show cities and rural areas are more susceptible to environmental injustice impacts as compared to suburban communities.
In the report, UMCES noted environmental justice as a priority issue and has incorporated EJI data in their scoring for the first time this year.
“This holistic approach [Environmental Justice Index] will make sure the report card is relevant to all communities in the Chesapeake watershed,” said Bill Dennison, vice president for science application at UMCES. “Addressing environmental justice is critical to ensure that restoration enhances long-term sustainability of the Chesapeake Bay watershed in an equitable way.”
Comments
There are no comments.
Thank you!
Your comment has been received. Before it can be published, the comment will be reviewed by our team to ensure it adheres with our rules of engagement.
Back to recent stories