Maps
Browse through maps depicting Bay health and restoration, including pollution trends, public access sites and more.
Congressional Districts in the Chesapeake Bay Watershed (118th Congress)
Date created: May 2, 2023This map shows the complete or partial Congressional Districts that make up the area of the Chesapeake Bay basin. The current senators and congressional members of the 118th Congress who have districts within the borders of the basin are listed by state.
View map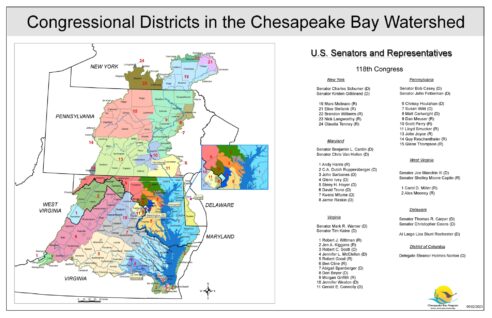
Chesapeake Bay Mean Surface Salinity (1985-2018)
Date created: October 10, 2019The salinity of the waters in the Chesapeake Bay and its tidal tributaries varies from season to season and year to year depending largely on the amount of freshwater flowing into the Bay. The salinity of these tidal waters has an effect on such things as fish spawning habitat, underwater grass species distribution, oyster distribution and the likely distribution of the oyster-killing parasites Dermo and MSX.
View mapFederal Lands and Facilities in the Chesapeake Bay Watershed
Date created: June 19, 2014This map was compiled by Chesapeake Bay Program staff to assist in the identification of Federally owned properties and facilities in the Chesapeake Bay Watershed.
View mapSAV Salinity Zones
Date created: April 21, 2014Up until 2013, submerged aquatic vegetation (SAV, also known as bay grasses) acreage totals for the Chesapeake Bay were aggregated into three zones: Upper Bay, Middle Bay and Lower Bay. For 2013, it was decided to report the totals by the four salinity zones found in the Bay: tidal fresh, oligohaline, mesohaline and polyhaline. Since different species of SAV are generally found in waters of a specific range of salinity, tracking changes in SAV abundance by salinity could help track changes in species abundance more easily.
View mapChesapeake Bay Segmentsheds
Date created: August 3, 2011This map displays the segmentsheds used by the Chesapeake Bay Program. A segmentshed is the discrete land area that drains into each of the 92 Bay Program segments (see map of Chesapeake Bay Segmentation Scheme) that have TMDLs associated with them.
View mapLong-Term Flow-Adjusted Trends Suspended Sediment (32 Sites in the Chesapeake Bay Watershed) 85-09
Date created: March 11, 2011Over the past 24 years, sediment concentration trends show mixed responses among the monitoring sites with the majority of results being not significant or downward. The trend results indicate that in some locations, management actions, such as erosion and runoff controls have reduced sediment concentrations in streams. The flow-adjusted trends indicator is calculated, and published annually by the U.S. Geological Survey as part of a larger effort to determine loads and trends in nutrient and sediment concentrations and streamflow in the Chesapeake Bay watershed. A complete description of data analysis methods can be found in Langland, M. J., and others, Changes in streamflow and water quality in selected nontidal basins in the Chesapeake Bay watershed, 1985-2004: U.S. Geological Survey Scientific Investigations Report 2006-5178, 75 p., available online at http://pubs.usgs.gov/sir/2006/5178/
View mapChesapeake Bay Counties
Date created: July 22, 2008A map showing the counties (and sometimes municipalities) that are entirely or partially within the Chesapeake Bay basin.
View map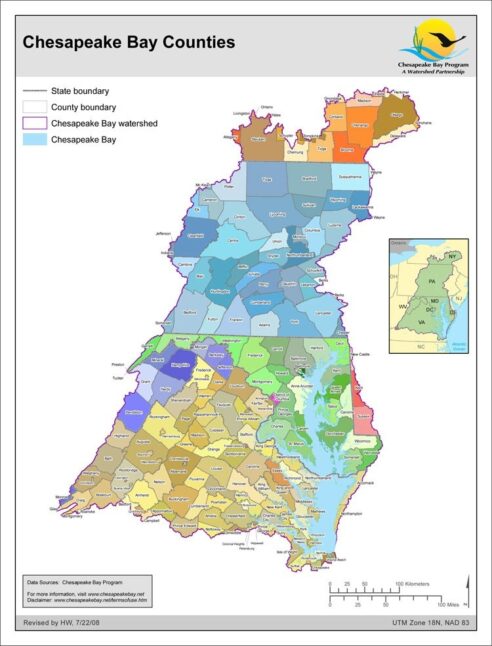
Chesapeake Bay Segmentation Scheme (For 303d listing - 92 segments)
Date created: June 4, 2008The 92-segment scheme for the Chesapeake Bay and its tidal tributaries used for dissolved oxygen and water clarity assessments in the most recent 303d/305b listing efforts of the four Bay tidal jurisdictions is documented here. The 92-segment scheme was derived from 1) the 2003 published 78-segment scheme with the addition of jurisdictional boundary lines imposed to create 89-segments, then 2) additionally includes only split segments agreed upon for the tidal James and Potomac rivers.
View map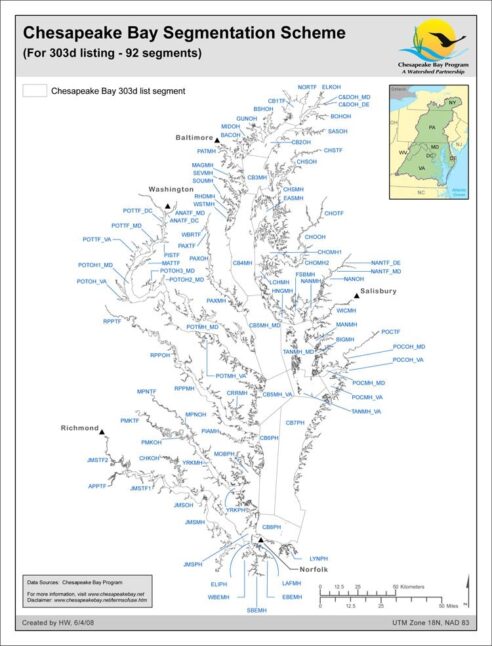
Dissolved Oxygen Designated Uses of the Chesapeake Bay and its Tidal Tributaries
Date created: April 18, 2008Sufficient dissolved oxygen (DO) is crucial for the fauna of the Chesapeake Bay to exist. Different aquatic organisms have different DO requirements. Many finfish need at least 5 mg/l while some bottom dwelling worms and clams need as little as 1 or 2 mg/l to survive. The different designated use zones (Open Water, Deep Water and Deep Channel) reflect the different needs of the species that inhabit different parts of the water column. Note: Some areas of the DO Designated Use were changed in 2007 from the original published map of 2003.
View map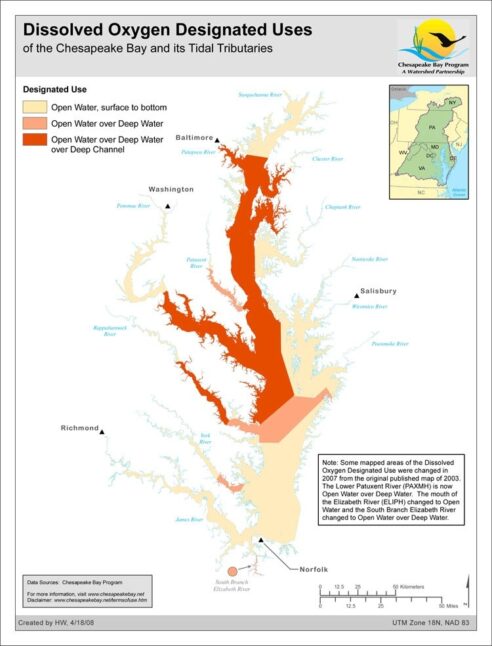
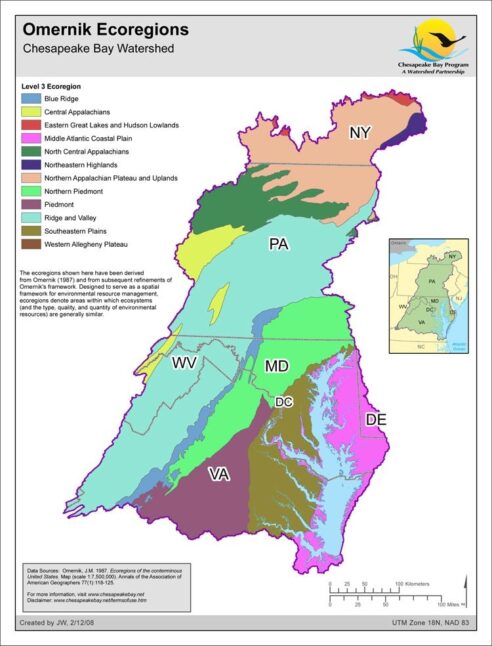
Omernik Ecoregions
Date created: February 12, 2008The ecoregions shown in this map have been derived from Omernik (1987) and from subsequent refinements of Omernik's framework. Designed to serve as a spatial framework for environmental resource management, ecoregions denote areas within which ecosystems (and the type, quality, and quantity of environmental resources) are generally similar. The approach used to compile this map is based on the premise that ecological regions can be identified through the analysis of the patterns and the composition of biotic and abiotic phenomena that affect or reflect differences in ecosystem quality and integrity (Wiken 1986; Omernik 1987, 1995). These phenomena include geology, physiography, vegetation, climate, soils, land use, wildlife, and hydrology. Omernik, J.M. 1987. Ecoregions of the conterminous United States. Map (scale 1:7,500,000). Annals of the Association of American Geographers 77(1):118-125. Omernik, J.M. 1995. Ecoregions: A spatial framework for environmental management. In: Biological Assessment and Criteria: Tools for Water Resource Planning and Decision Making. Davis, W.S. and T.P. Simon (eds.) Lewis Publishers, Boca Raton, FL. Pp. 49-62. Wiken, E. 1986. Terrestrial ecozones of Canada. Environment Canada. Ecological Land Classification Series No. 19. Ottawa, Canada.
View map